PRISMA Hyperspectral Satellite Imagery Download and Evaluation
In this short blog post I will show you the steps of downloading satellite images from PRISMA database and will say a few words about evaluation.
The PRISMA satellite is at the moment the highest resolution and spectral range multi/hyperspectral satellite there is. It covers the visible and near infrared (400-1010nm) range on 60 bands (12nm resolution) and the shortwave-infrared (920-2505nm) on 171 bands (12nm resolution). Spatial resolution is about 30m/pixel. There is co-aligned panchromatic channel as well which captures monochrome images of the full visible spectrum 400-700nm at 5m/pixel spatial resolution.
You probably know how interesting hyperspectral data can be, this guide should serve as a quick intro to download imagery from the PRISMA database.
Download
As a first step you will need an account. It’s free to register for educational purposes so if you are part of an institution, study at the university or just have general interest in hyperspectral imaging, you will likely get an account.
Once you have your login and password; you can log in at the http://prisma.asi.it/ website. There is a User Manual available here to download, but in most cases you will need only the amount of information what I will shortly summarize here.
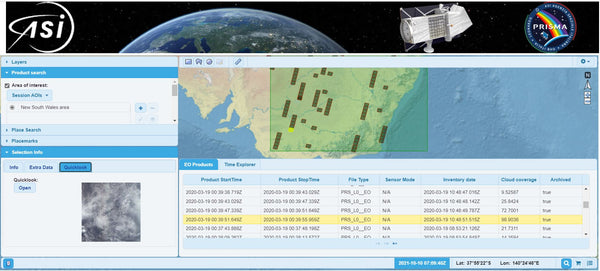
After logging in you get to the main screen, showing Italy as default on the map (PRISMA is taken care of by the Italian space agency)

On the left side under “Place Search” tab, you can enter your city, county, country, region of interest. After hitting Enter, you get a list of matches. Left click on the item will select it also on the map, right click and “Use as query area” will add it to your search on the “Product Search” tab.

On the "Product search" tab, you just have to hit “Submit” and the available satellite images will appear on the map and the list of images with acquisition time and cloud coverage will be just under the map.

Unfortunately, there is no global coverage yet, but there is a tool where you can check when the satellite will see certain regions on the globe. PRISMA Pre-Feasibility Tool ..Important to say, that it doesn’t mean that data will be collected at that time and position, it just means that users who have the privilege to order acquisition, can schedule that on time. About this maybe in another post.
Before moving on and downloading an image, it’s good to check the cloud coverage. The listed values are in percentages. I found that the values below 35% are not always accurate, but you surely want to check this before downloading the data. To do a quick check on the appearance, select a item from the list and check out the “Quicklook” tab inside the “Selection Info” tab.
If you like what you see, right click on the item and select “Add to basket”. This will trigger a dialogue where you can select which visible-near infrared and shortwave-infrared channels you want to download.
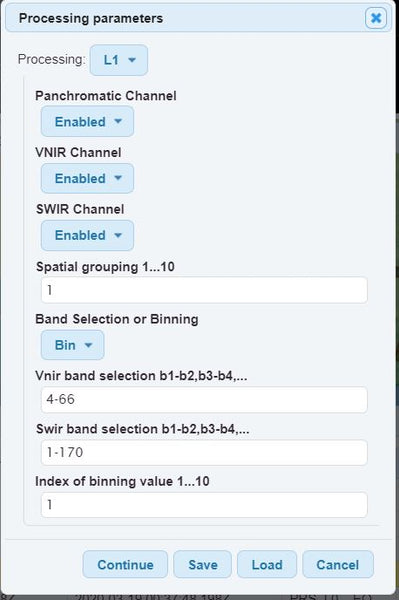
Grouping and binning can be also selected. Panchromatic channel is a monochrome image of the acquisition area at a higher resolution (6000x6000) than the other channels (1000x1000). Processing level description from the manual:
“Here it is a very brief description of the available products
Level 1 (HYP/PAN) radiometrically corrected and calibrated radiance data in physical units. This product provides: Top-of-Atmosphere Spectral Radiance; Cloud mask; Sun-glint Mask; Calibration and characterization data used and Classification Mask;
Level 2B - Geolocated at Ground Spectral Radiance Product (HYP/PAN);
Level 2C - Geolocated At-surface Reflectance Product (HYP/PAN). This product includes Aerosol Characterization Product (VNIR), Water Vapour Map Product (HYP) and Cloud Characterization;
Level 2D - Geocoded version of the level 2c products (HYP PAN).”
After putting the image if your basket, you either continue browsing for more data or go straight to the basket and “order” the selected images. ("Order Items" left bottom)


After ordering the items, your order will be processed (which can take even a few hours) and you will be sent a link where you can download the requested data.
The data will be in HE5 format. There is an open source R code which you can use for selecting subsets, but for instance ENVI Software can recognise this data type too.
If you want to look at the data in Scyven (free), you will need HRD, HSZ or TIF format.
Processing data
There are a couple of paid and free software available for processing the data. I’m no remote sensing expert but from what I read, ENVI is probably the best choice and Scyven is the best free choice.
Here is an example image of the Alps from the SWIR channel shown in Scyven:

In Scyven the evaluation is only a few steps. First you select which channels you want to see as Red Green Blue, then you click recover illumination, then recover reflectance and at the end click material discovery.
In the illumination chart of the above example you might recognize the SWIR spectra of the sun including the atmospheric absorption bands. The reflectance charts show some snow, water and vegetation. You can choose the different recognized materials in Scyven and analyse those which appear to be special. Visiting the area personally or just from Google Earth will reveal why it is so special. It's fun!
Good luck!
One question, are there any images of Peru also available?
Thank you for the PRISMA tutorial! It is very clear and easy to follow. Please message me back if there is a PRISMA users community that I can join. There was also a short PRISMA video tutorial on the EO College MOOC “Beyond the Visible – Introduction to Hyperspectral Remote Sensing” which I just finished. I am anxiously awaiting the on-orbit commissioning of two more great Hyperspectral instruments, EMIT (data should be available from NASA LP DAAC in March) and EnMAP (https://www.enmap.org/) January 16, 2023. I found that NASA-ISS Ecostress has very good IR data which I have used for UHI (Urban Heat Index) mapping. (https://ecostress.jpl.nasa.gov/).